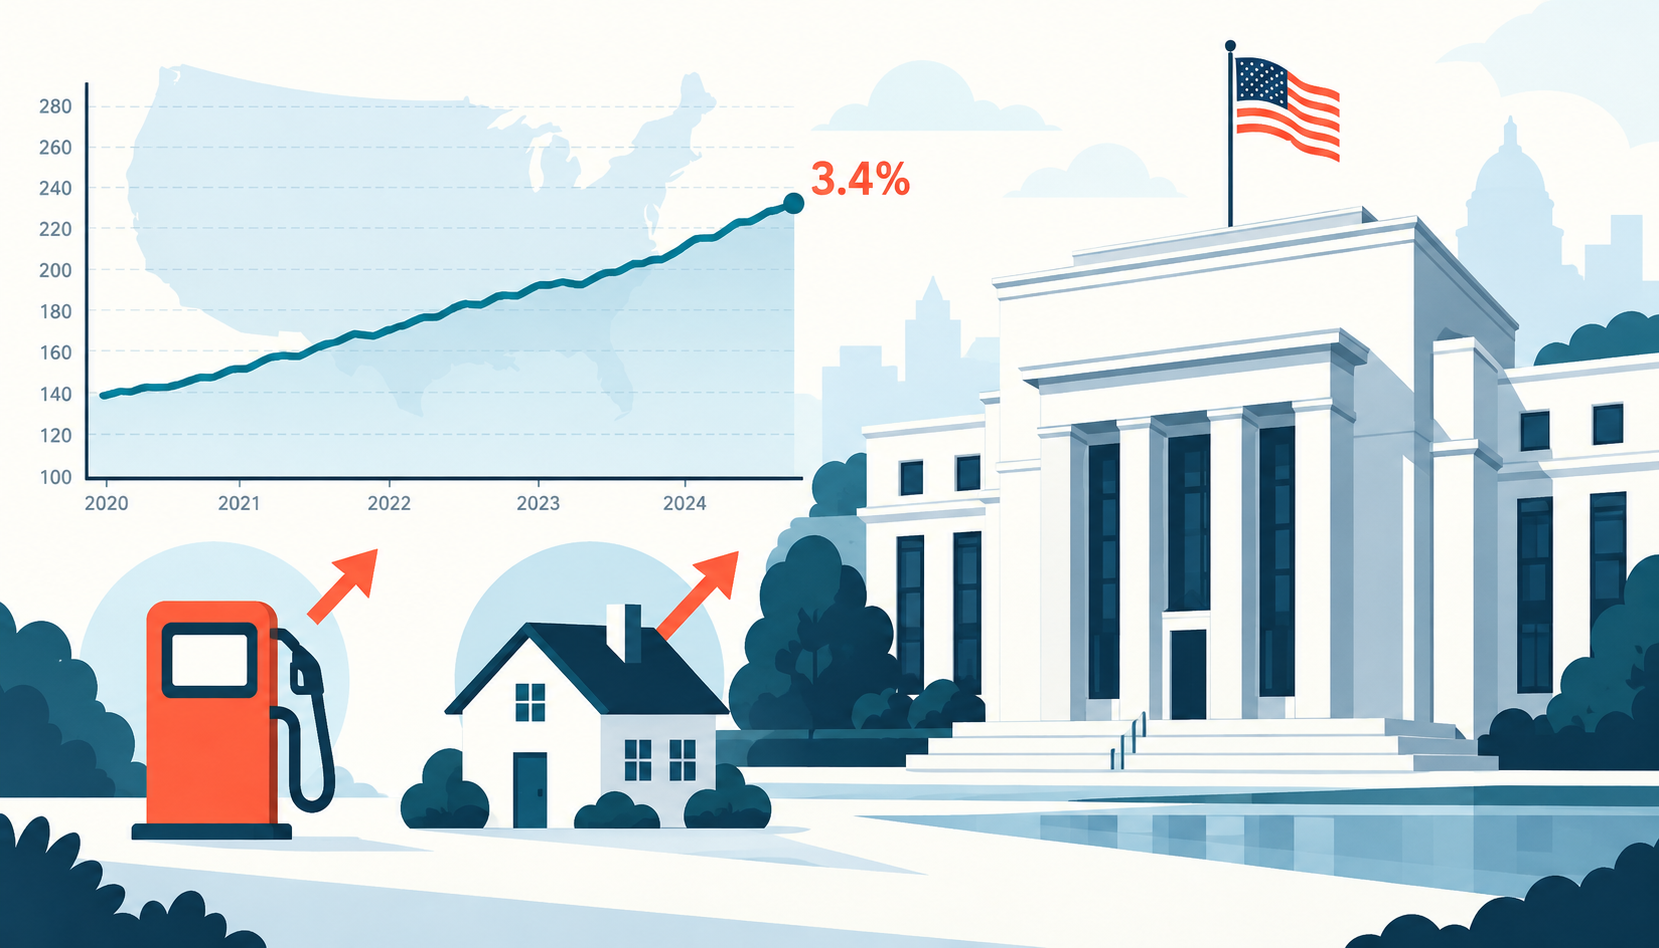
US producer prices rose more quickly in August, driven largely by an abrupt increase in energy costs that put diesel fuel at the center of the report. The Bureau of Labor Statistics said its final-demand Producer Price Index increased 0.4% from July after a 0.1% gain in July and a 0.1% decline in June. The index was 5.4% higher than a year earlier.
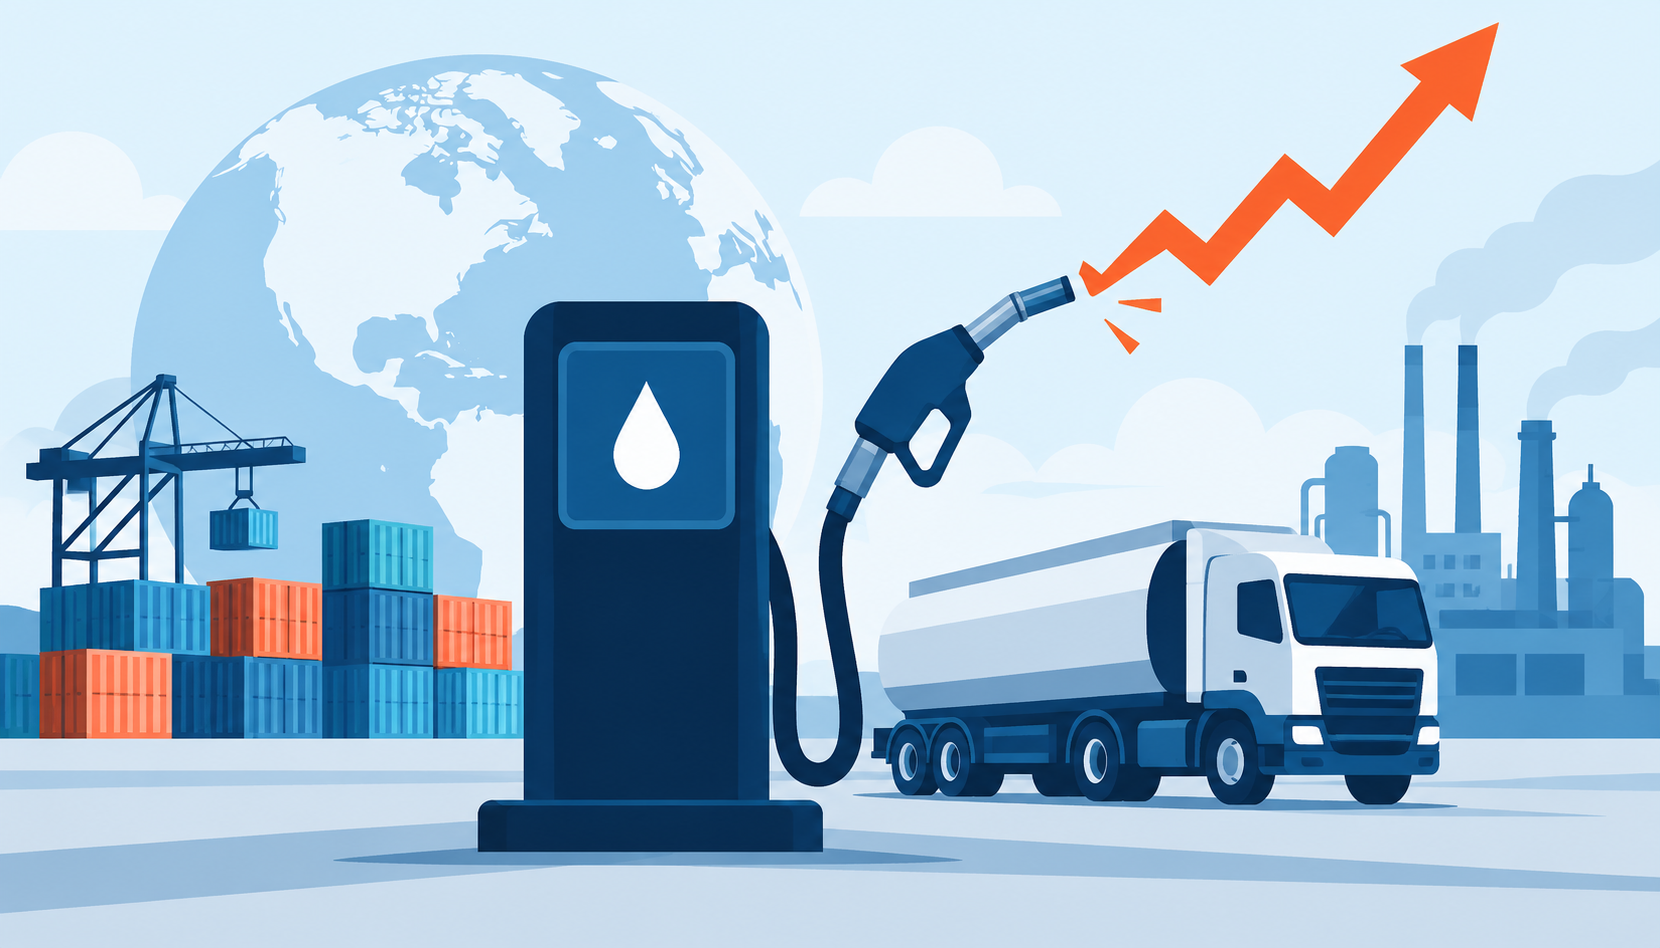
The monthly increase was broad enough to matter for companies that buy fuel, move freight, or renew supply contracts, yet concentrated enough to require careful reading. Final-demand goods prices rose 1.1%, while services prices edged up 0.1%. More than three quarters of the goods advance came from final-demand energy, which rose 4.2%. Diesel fuel alone jumped 24.1% in August and accounted for more than one third of the increase in final-demand goods, according to the release.
That composition distinguishes the report from a uniform acceleration across the production economy. Energy is a direct input for trucking, industrial equipment, agricultural operations, construction, air cargo, marine transport, and backup generation. A sharp one-month move can therefore reach a wide set of cost centers. It does not automatically become a persistent inflation trend. The next question is whether fuel prices hold, whether carriers can pass costs through, and whether other producer prices follow.
A Goods-Led August Reading
The final-demand index measures price changes received by domestic producers for goods, services, and construction. It is a seller-side measure, unlike the Consumer Price Index, which tracks prices paid by urban consumers. The BLS PPI handbook overview explains that the program is designed to capture average price change from the producer’s perspective. That distinction matters when assessing the August report: a rise in PPI can signal pressure in business cost chains without mapping one-for-one into consumer inflation.
Final-demand goods increased 1.1% after two consecutive monthly declines. Energy rose 4.2%, goods excluding food and energy increased 0.4%, and food prices gained 0.1%. In addition to diesel, the BLS reported increases in gasoline, jet fuel, home heating oil, candy and nuts, and tobacco products. Residential electric power prices fell 0.5%, while fresh sausage and aluminum mill shapes also declined.
The mix shows why the headline should not be treated as a single fuel statistic. A 0.4% increase in goods excluding food and energy means pressure was present beyond the energy complex. Still, the report identifies diesel as the largest specific contributor. For freight-heavy industries, that detail is more operationally useful than the aggregate final-demand number. Diesel is commonly purchased by fleets and logistics contractors, and it can affect delivered costs across domestic supply chains even when the goods themselves are not energy products.
The annual figures also remain elevated. Final demand was up 5.4% over 12 months, and final demand less foods, energy, and trade services rose 4.7% over the same period. The latter measure increased 0.3% in August after a 0.4% advance in July. It is often watched because it excludes categories with volatile price movements and trade margins, although it is still a producer-price measure rather than a direct forecast of consumer inflation.
Services Were Firmer, but Less Dramatic
Final-demand services increased 0.1% for a third consecutive month. Transportation and warehousing services rose 2.3%, providing a second link between the report and freight costs. Truck transportation of freight advanced 2.0%. Airline passenger services, legal services, hospital inpatient care, and partial retailing of automobiles also moved higher.
Other service categories moved in the opposite direction. Trade services declined 0.2%, and services excluding trade, transportation, and warehousing were unchanged. Margins for fuels and lubricants retailing fell 11.3%, while health, beauty, and optical-goods retailing, machinery and equipment wholesaling, and portfolio management also decreased. A retail margin is not the same thing as the price of the item sold. The margin data can move differently from upstream fuel prices because they reflect the difference between selling and acquisition prices.
For investors and risk managers, the service detail limits the case for reading August as an indiscriminate price shock. The transportation increase deserves attention because it can affect the cost of moving goods from ports, factories, and warehouses to customers. Yet the narrow 0.1% overall services gain and the decline in trade services show that pricing conditions were uneven. Companies with contractual fuel surcharges may recover higher costs more quickly than firms that have fixed-price shipping commitments.
Diesel as a Transmission Channel
Diesel has a wider economic reach than its share in household budgets might suggest. Road freight depends on it directly, and logistics costs affect inventories, retail replenishment, construction materials, farm inputs, and industrial distribution. A 24.1% monthly movement in the BLS diesel index is therefore a signal to inspect contracts and freight exposure, rather than a conclusion that every producer will raise prices.
The pace of pass-through depends on commercial arrangements. A carrier with a fuel-surcharge clause may revise invoices as published fuel benchmarks change. A manufacturer that has agreed to a fixed delivered price may absorb the increase until the contract resets. A distributor may have a mix of owned fleet, third-party trucking, and customer pickup, each with different exposure. These differences determine whether higher diesel costs affect gross margins, working capital, or final selling prices.
Timing also matters. The BLS data report average price changes over the reference month. Physical fuel purchases, invoicing schedules, hedges, storage, and inventory cycles can cause company results to lag the PPI move. A firm that secured fuel earlier may see less immediate pressure than a competitor buying at spot prices. Conversely, a logistics provider that is contractually entitled to surcharge customers may see revenue move with fuel costs while operating margins remain more stable.
The report does not establish the cause of the diesel increase. The BLS release records price change; it does not attribute that change to a particular refinery disruption, crude-market development, tax change, or transport constraint. Any explanation of the energy move requires separate evidence. That limitation is important because an analyst should not assign a lasting macroeconomic narrative to one monthly price observation without confirming the underlying market drivers.
What It Means for Inflation Monitoring
The Federal Reserve and market participants follow several inflation measures, including consumer prices, personal consumption expenditures, wages, import prices, and producer prices. PPI can provide useful detail about upstream pricing and service margins, but the index has a different coverage and weighting structure from consumer measures. The BLS notes that PPI measures changes in prices received by domestic producers, while CPI is viewed from the buyer side.
For the near term, August creates a practical monitoring list. First, analysts will look for confirmation in fuel benchmarks and subsequent energy data. Second, they will watch whether truck freight and warehousing prices keep rising after the 2.3% increase in August. Third, they will compare the PPI results with consumer-price data for evidence that cost pressure has reached household-facing categories. Fourth, they will assess whether the 0.4% gain in goods excluding food and energy broadens over future reports.
The BLS release also cautions that recent figures can change as additional reports and corrections arrive. Data for April through July were revised in the August release. Revisions are normal for PPI and should be included in any comparison with market forecasts or prior-month narratives. An initial surprise may look different after seasonal factors and late responses are incorporated.
For corporate planning, the relevant issue is exposure rather than the headline alone. An airline evaluates jet fuel, ticket pricing, and hedging. A construction company looks at equipment fuel, asphalt, trucking, and project terms. A retailer considers inbound freight, distribution-center costs, and promotional margins. A food producer faces agricultural fuel and cold-chain logistics alongside its own packaging and labor costs. These channels can produce different results even under the same national PPI release.
The Policy and Market Context
The 5.4% year-over-year rise in final demand will keep producer-price trends in focus because it is well above levels normally associated with stable broad inflation. However, the composition argues for precision. Energy was the largest force in August goods, and services were restrained at the aggregate level. The core-like measure excluding foods, energy, and trade services rose 0.3% for the month and 4.7% over 12 months, which indicates that price pressure was not confined to fuel, while still leaving open how durable the monthly acceleration will be.
Bond markets can react to a stronger producer-price report through expectations for consumer inflation and monetary policy. The response need not be linear. Investors will weigh the breadth of the increase, revisions to previous data, separate consumer-price releases, labor-market conditions, and the path of energy prices. A single report with a large diesel component may lead to greater attention to commodity and freight developments than to a wholesale reassessment of policy rates.
For lenders, rising transportation and energy costs can alter borrower cash flows unevenly. Highly leveraged logistics, trucking, construction, agriculture, and industrial companies may have limited ability to absorb a rapid fuel move. Stronger borrowers may have hedges, surcharge mechanisms, or diversified contracts. Credit review should therefore test the sensitivity of earnings and liquidity to higher fuel and freight costs instead of applying the same stress across all sectors.
Analyst’s View
The August PPI report puts diesel and freight costs at the front of the risk map. The first implication is for credit analysis. Lenders should identify borrowers whose contracts delay fuel-cost recovery and examine whether working-capital needs rise when fuel invoices increase before customer prices reset. A one-month index move is not a default forecast. It can still expose weak contract design and narrow liquidity buffers.
The second implication concerns sovereign and market risk. If energy-led producer inflation persists, it can complicate the policy outlook by keeping inflation measures firm even if demand-sensitive service categories remain soft. Rate-sensitive assets may react more to evidence of broadening pressure than to the initial diesel surge itself. Monitoring later PPI releases, fuel markets, and consumer-price data will help separate a temporary energy impulse from a wider price cycle.
The third implication is for positioning within equity and credit markets. Businesses with explicit fuel pass-through clauses, prudent hedging, and pricing power may manage the shock better than companies with fixed transport commitments. The BLS report gives investors a reason to examine those balance-sheet and contract differences now. It does not provide a universal conclusion about earnings, inflation, or interest rates.
August producer inflation was led by a large energy move, with diesel fuel carrying unusual weight in the goods result. The data warrant closer attention to transportation costs and the pace of pass-through. They also require restraint: the report shows a measured set of price changes, revisions, and category-level offsets, not a complete account of where US inflation will settle.