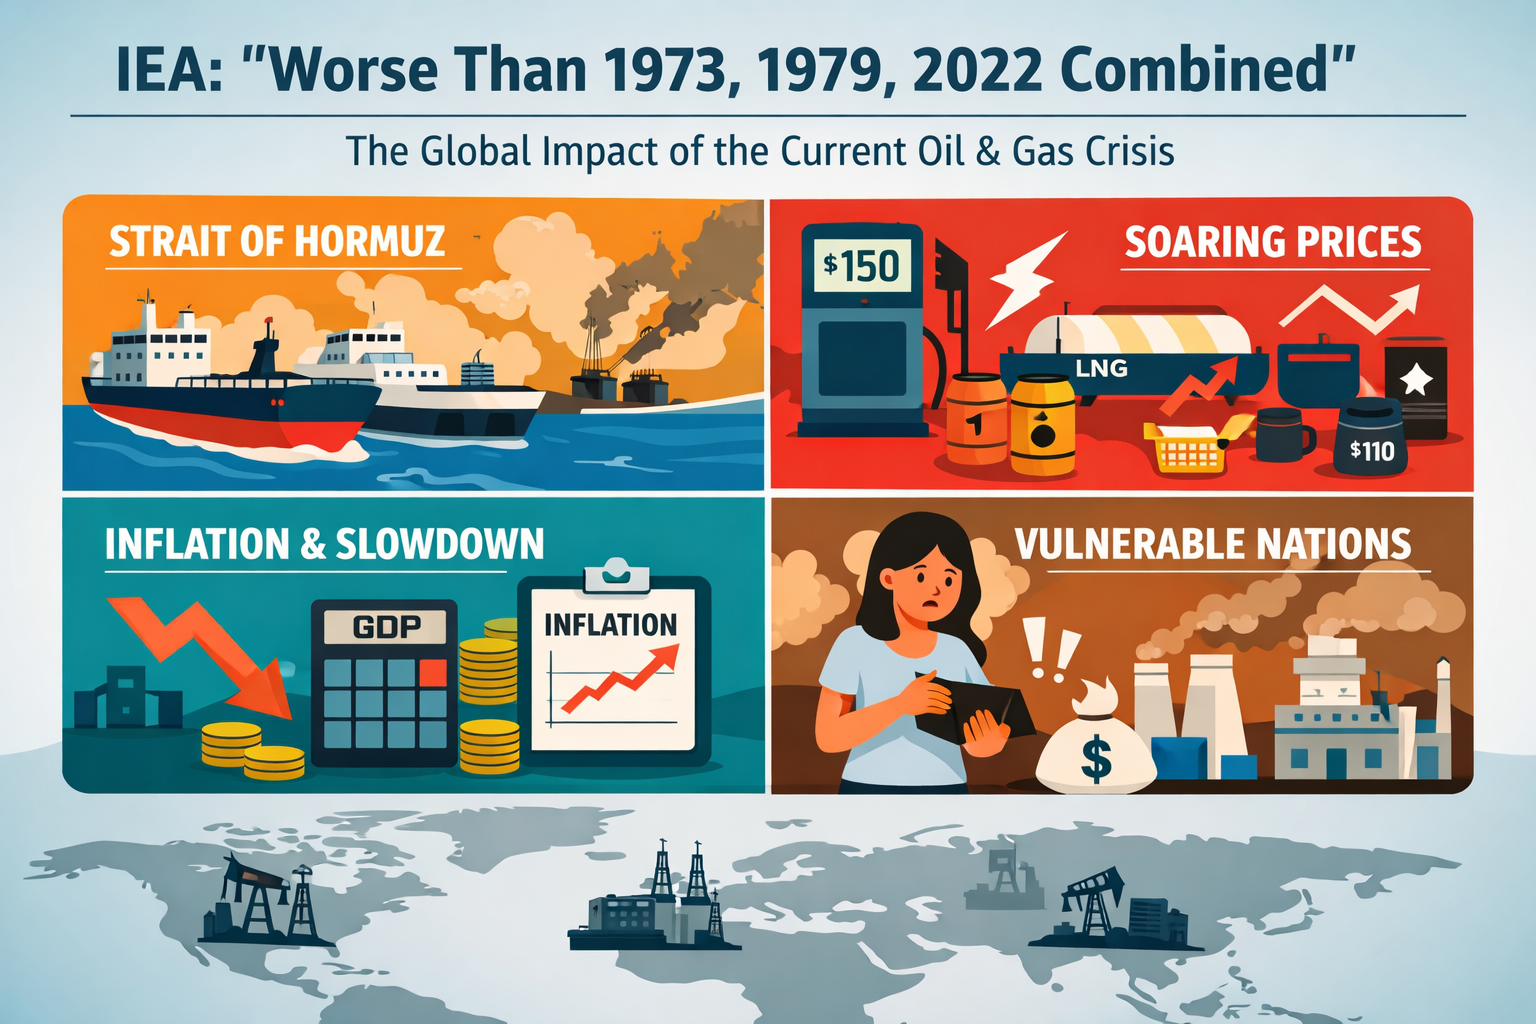
There have been three moments in the past half-century when the global oil market broke in ways that rearranged economies for years afterward: 1973, when the Arab oil embargo sent prices quadrupling; 1979, when the Iranian revolution triggered a second devastating spike; and 2022, when Russia’s invasion of Ukraine pushed gas prices in Europe to levels not seen since the industrial revolution. Each of those shocks had a distinct cause and a distinct geography. What makes the current crisis different, according to the International Energy Agency, is that it combines the worst features of all three — and may surpass them. IEA Executive Director Fatih Birol has stated plainly that the current oil and gas crisis is worse than 1973, 1979, and 2022 together. That is not a rhetorical flourish. It is a description of the arithmetic.
The Chokepoint at the Center of Everything
The Strait of Hormuz is a narrow passage — at its tightest, about 33 kilometers wide — that sits between Iran and Oman at the mouth of the Persian Gulf. Through it, roughly 20 million barrels per day of crude oil and petroleum products moved in 2025, according to IEA data. That represents approximately one-fifth of global oil consumption. Around 20 percent of global liquefied natural gas — the fuel that heats European homes and powers Asian factories — passes through the same channel.
No other single chokepoint in the world comes close to that concentration of energy traffic. Pipelines can be built around other bottlenecks. Hormuz cannot be bypassed at anything like the volumes currently moving through it. When the strait functions normally, it is essentially invisible to most of the world. When it does not, the effects appear almost everywhere within weeks: in fuel pump prices, electricity bills, airline tickets, fertilizer costs, and ultimately in the price of food.
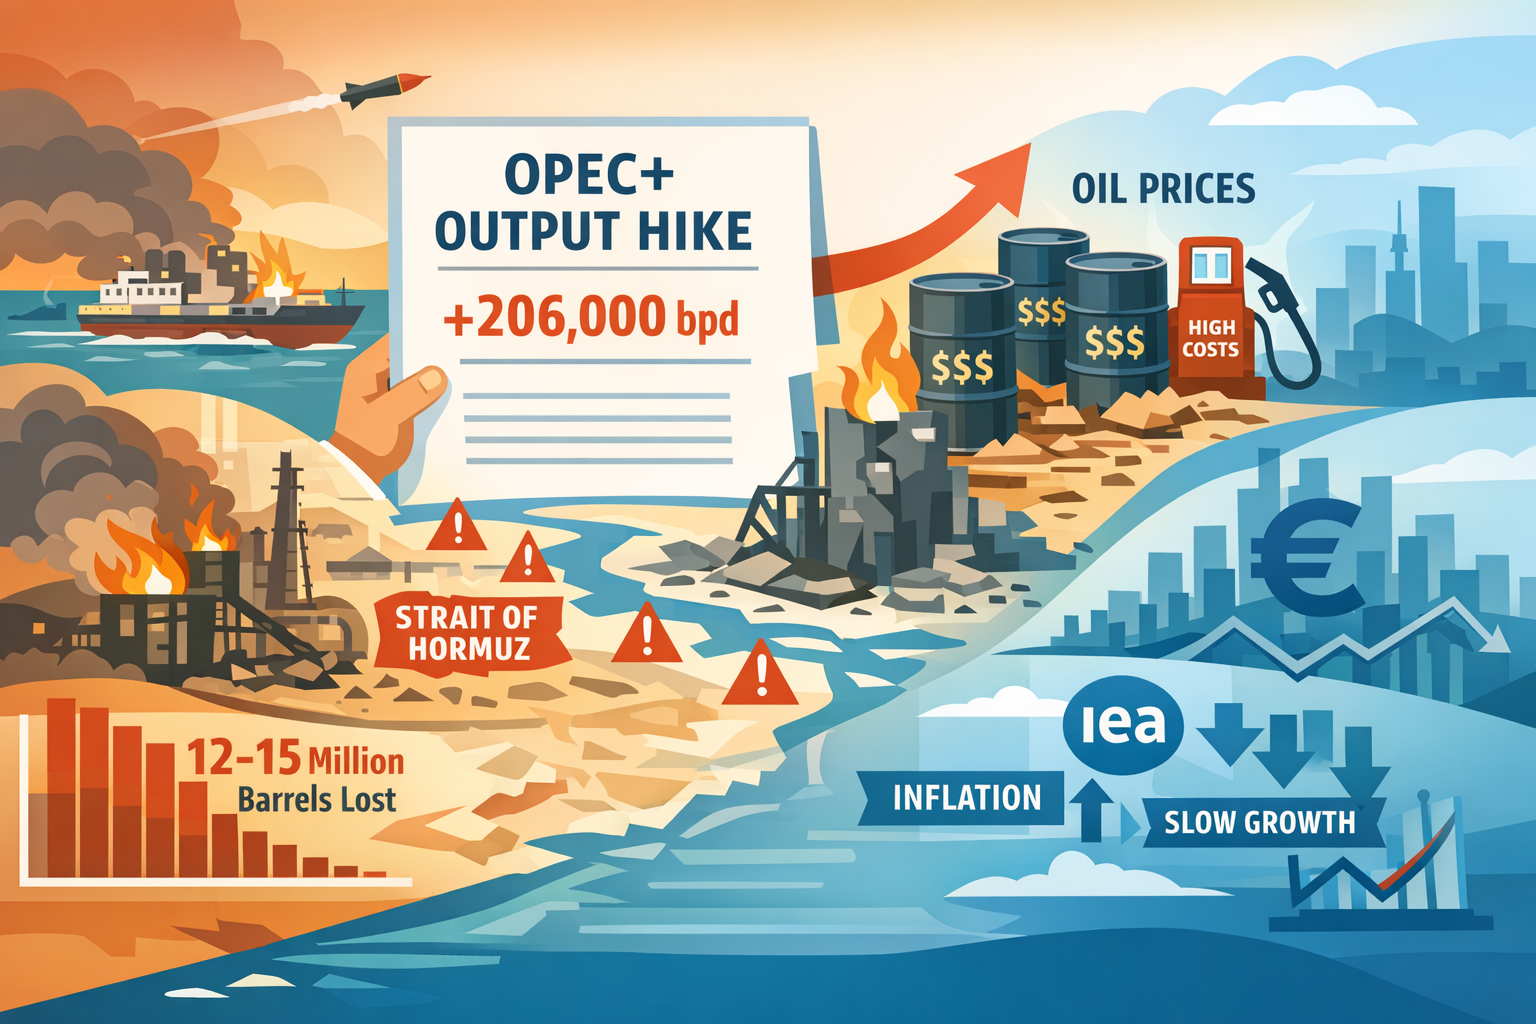
The de facto closure of the strait, and damage to regional energy infrastructure, has produced what the IEA has described as the largest supply disruption in the history of the global oil market. Global oil supply has been cut by approximately 13 percent, according to IMF estimates reported by Reuters. For a market that had been finely balanced heading into 2026, that is not a temporary inconvenience. It is a structural shock.
Not Just Oil
The reflex when oil prices surge is to look at the Brent crude futures price and treat that as the story. It is not the full story here. Brent settled near $110 a barrel as recently as Monday, but physical crude — the immediate-delivery oil that refiners actually need to keep running — hit close to $150 a barrel for some grades. That gap between paper prices and real-world prices matters. It tells you that refiners are scrambling, not speculating. The physical market is signaling genuine shortage, not just financial anxiety.
The strain is not confined to crude. European jet fuel prices reached around $226 per barrel, near record highs. Diesel was close to $204. These are not incidental products. Jet fuel is what moves people and express freight around the planet. Diesel is what moves food, construction materials, and manufactured goods everywhere else. Liquefied petroleum gas — used for cooking and heating by hundreds of millions of households across Asia and Africa — is also under pressure. When the IMF describes this as “a large, sudden tax on income” for fuel-importing economies, it is pointing at exactly this cascade: the shock does not stay in the crude oil barrel. It spreads outward through every product derived from it.
LNG markets add another dimension. Europe had spent years after 2022 diversifying away from Russian gas. A significant portion of the LNG that replaced it moves through Hormuz. The IMF notes that countries like Italy and the United Kingdom, heavily reliant on gas-fired power generation, face a particular vulnerability, while France and Spain — with larger nuclear and renewables capacity — have somewhat more insulation. That divergence matters for European politics as much as European economics.
The Macro Transmission: Inflation First, Then Growth
For most economies, the mechanism is fairly direct. Higher energy costs raise production costs across nearly every sector. Firms either absorb the squeeze on margins or pass it through to consumers. Households, spending more on fuel and power, have less to spend on everything else. Central banks, facing renewed inflation pressure after several years of painful effort to bring it down, face an ugly choice between tightening policy into a slowing economy or tolerating higher prices.
The IMF’s language on this is careful but unambiguous: “all roads lead to higher prices and slower growth.” Before the conflict escalated, the IMF had been projecting global growth of 3.3 percent in 2026 and 3.2 percent in 2027. Both figures are now expected to be revised downward. IMF Managing Director Kristalina Georgieva has told Reuters that the war in the Middle East will lead to slower growth and higher inflation — a combination that, in technical terms, is called stagflation, and that central banks in wealthy countries spent most of the 1970s and 1980s trying to escape.
Supply chain disruptions add friction beyond the energy price channel. Tankers and container ships rerouting around the Gulf face longer voyages, higher insurance premiums, and fuel surcharges of their own. Air traffic disruptions around Gulf aviation hubs — some of the world’s busiest connecting points — are rippling into tourism, logistics, and trade. None of these costs are enormous individually, but they arrive simultaneously, compounding the primary energy shock.
Who Gets Hit Hardest
The IMF has calculated that 85 percent of its member countries are net energy importers. That number alone communicates the breadth of the exposure. But within that group, the distribution of pain is heavily uneven.
Wealthy energy-importing nations — Japan, Germany, South Korea, France — can deploy fiscal buffers, central bank credibility, and diversified trade relationships to cushion the blow. They will be hurt. The question for them is how much, and for how long.
For lower-income energy-importing countries in Africa, South Asia, and parts of Latin America, the calculation is harsher. The IMF notes that economies heavily dependent on oil imports are finding it increasingly difficult to access the supplies they need, even at sharply inflated prices. These countries have limited fiscal space to subsidize consumers, weaker currency reserves to absorb balance-of-payments pressure, and populations that spend a higher share of income on energy and food. The IMF specifically flags the risk of food insecurity, because higher energy prices drive up fertilizer costs and freight costs simultaneously. For some of these countries, the IMF warns, additional external support may be needed — even as such support has been trending downward.
Oil-exporting countries are not uniformly insulated either. Exporters that can still get their barrels to market — certain African and Latin American producers, for instance — may see genuine windfall revenue. Gulf producers whose exports are constrained or disrupted benefit far less than the headline price might suggest. Higher risk premia and sustained uncertainty, the IMF observes, may curb investment and growth even in the exporting world once the immediate crisis passes.
The Physical Market Signal
Futures markets are often treated as the definitive read on oil. But in a genuine supply crunch, the physical market — where actual oil changes hands for immediate delivery — tends to speak more honestly about real-world conditions. The premium of physical crude over futures benchmarks has widened sharply, reflecting the scramble among refiners to secure prompt barrels. Refiners cannot run on futures contracts. They need physical oil, now, and they are paying well above the published Brent price to get it.
This gap — technically called a backwardation or a cash premium — is not unusual in a tight market. What is unusual is the magnitude. When physical grades are running $40 above futures in some cases, the futures price understates the immediate stress in the system. Traders and procurement managers reading only the Brent headline are, to some degree, missing the real story.
What Can Actually Be Done
Strategic petroleum reserve releases are the immediate tool, and the IEA has already outlined consumer-side measures. Reserve releases can smooth price spikes and reassure markets in the short term. They cannot replace months of sustained supply loss. The IMF is cautious about broad energy subsidies, which can be costly to fiscal positions, hard to unwind, and often poorly targeted. Targeted relief for lower-income households is more efficient but more politically difficult to engineer quickly. Demand-side conservation measures — the kind the IEA promoted in 2022 for gas — are an option, but take time to bite.
The harder problem is that none of these tools address the structural source of the disruption. They are ways of managing a shock, not resolving one.
What This Crisis Actually Reveals
The most important thing the current disruption exposes is not a data point but a dependency. Fifty years after 1973, the global economy’s relationship with a handful of hydrocarbon chokepoints remains essentially unchanged. Diversification efforts — renewables expansion, LNG infrastructure buildout, efficiency gains — have progressed significantly. They have not progressed enough to make a prolonged Hormuz closure anything other than a genuine macro shock.
The IEA’s comparison to 1973, 1979, and 2022 is not designed to induce panic. It is a structural observation: when a single narrow waterway can simultaneously disrupt crude oil, refined products, and LNG markets on a global scale, the world’s energy architecture has a fragility that no amount of financial hedging fully addresses. The current crisis will eventually resolve. The question it leaves behind is whether the response — in investment, in policy, in infrastructure — is serious enough to mean that the next disruption of this kind is smaller, not larger, in its global reach.