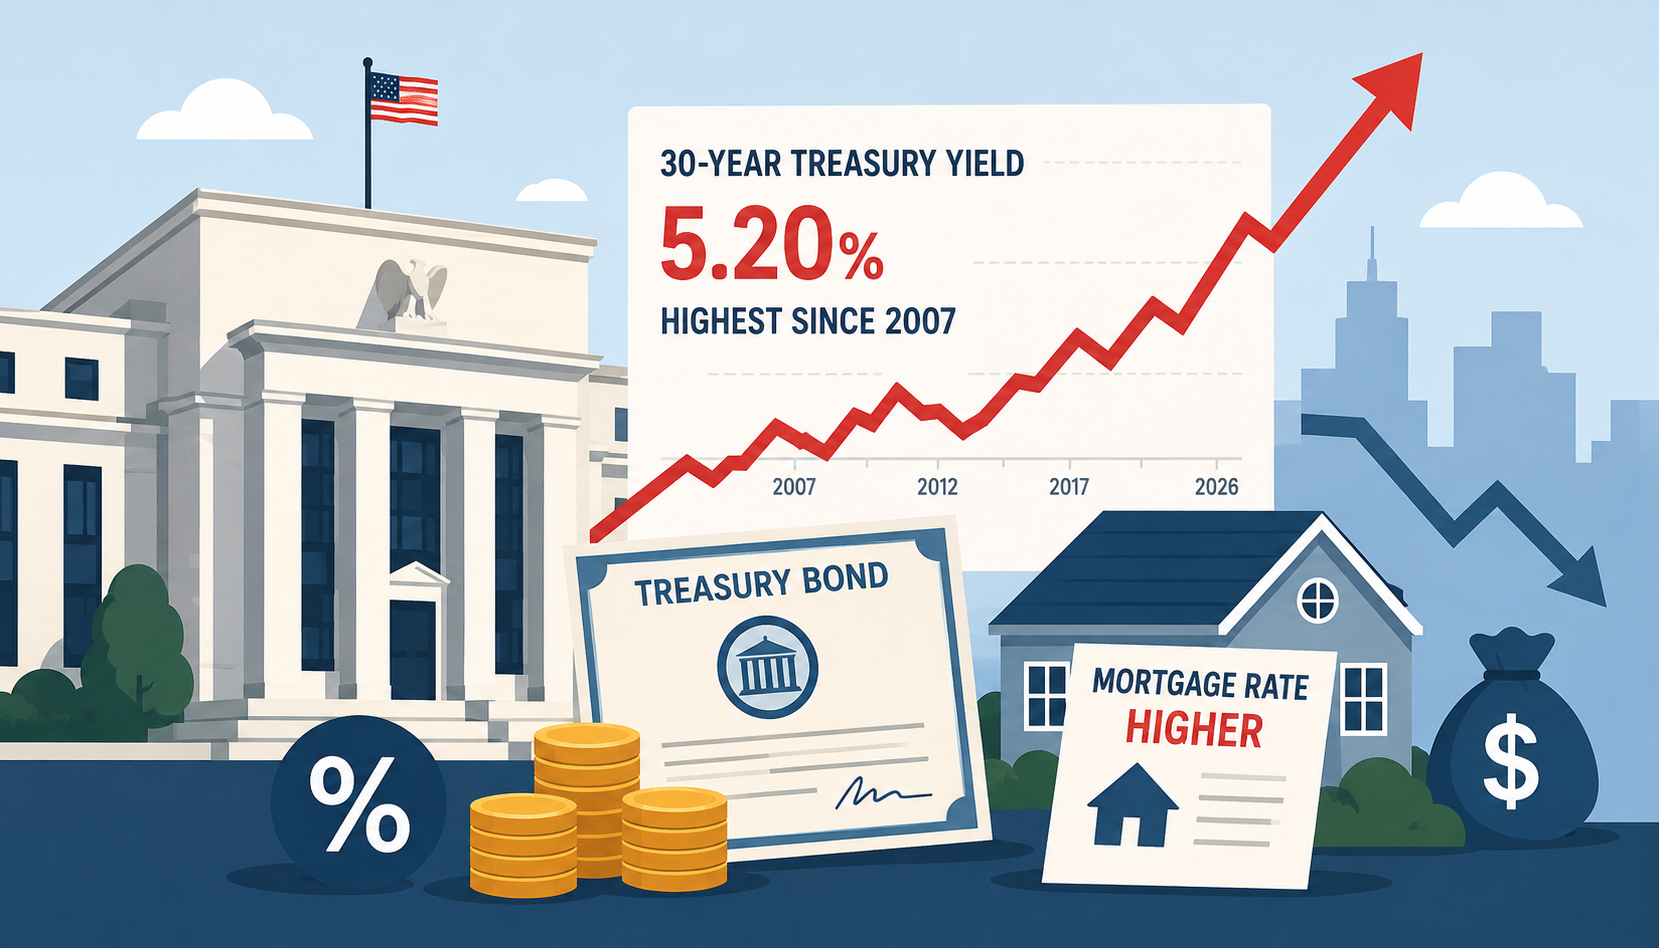
The U.S. bond market is again forcing investors to ask an uncomfortable question: what if long-term interest rates stay high for longer than expected? The 30-year Treasury yield has climbed to a level last seen in 2007, reviving memories of tighter financial conditions before the global financial crisis and putting pressure on equities, mortgages, and fiscal assumptions.
On Tuesday, May 19, the long bond briefly traded above 5.19%, its highest in close to two decades, while the 10-year note — the benchmark most directly tied to mortgages and consumer credit — touched 4.687%, a level not seen since January 2025. None of this happened in a vacuum. It is the latest move in a selloff that has been building for weeks, and it is now spilling into stocks and rippling through bond markets in Europe and Japan.
Why the 30-Year Yield Matters
The 30-year Treasury yield is one of the most important reference rates in global finance. It anchors the cost of long-dated borrowing for everyone from homebuyers to corporations to governments. When it moves, mortgage pricing, corporate bond yields, pension fund liabilities, infrastructure project finance, and equity valuations all shift with it.
A quick clarification for readers less familiar with bond mechanics: yields and prices move in opposite directions. When the 30-year yield rises, the market price of existing long-dated bonds falls. So a “selloff” in the bond market and a “rise in yields” describe the same event from two angles — investors selling bonds, which pushes prices down and yields up.
The long end of the curve is also where what analysts call duration risk is most concentrated. Duration measures how sensitive a bond’s price is to a change in interest rates; the longer the maturity, the larger the price swing for any given move in yield. That is why a 30-year bond can lose value far faster than a two-year note when rates climb — and why the long bond is the part of the market that most clearly reflects investors’ views on inflation and fiscal sustainability over decades, not quarters.
What Happened in the Market
According to Bloomberg, the 30-year yield rose as much as seven basis points to 5.20% on Tuesday, a level last seen in 2007, on the eve of the global financial crisis. Barron’s, citing Tradeweb FTSE data, put the move slightly lower at 5.180%, still the highest since July 13, 2007. The U.S. Treasury’s own daily par yield curve and the Federal Reserve’s H.15 release had the 30-year constant maturity yield at 5.14% as of the May 18 close, before Tuesday’s intraday push higher.
This was not an isolated Treasury event. Bond markets across Europe and Japan also fell, while the selloff spilled over into US equity markets. Heavy futures trading amplified the move, with Bloomberg reporting volume in the 10-year contract running close to twice its recent average during the New York morning session.
Equities took the hit. The S&P 500 closed down 0.67%, ending at 7,353.61, while the Nasdaq Composite finished 0.84% lower at 25,870.71. The Dow Jones Industrial Average shed 322.24 points, or 0.65%, to close at 49,363.88. It was the S&P 500’s third straight losing session. Homebuilder stocks were among the weakest performers, a direct reflection of where higher long-term yields land first.
Why Inflation Anxiety Is Driving the Selloff
The core of the story is inflation that has refused to fade. The Bureau of Labor Statistics reported that the Consumer Price Index for All Urban Consumers increased 0.6 percent on a seasonally adjusted basis in April, after rising 0.9 percent in March, and rose 3.8 percent over the last 12 months. That annual figure was the highest since May 2023. Core CPI, which strips out food and energy and is generally treated as a cleaner read on the underlying trend, was up 2.8% over the year — still well above the Federal Reserve’s 2% target.
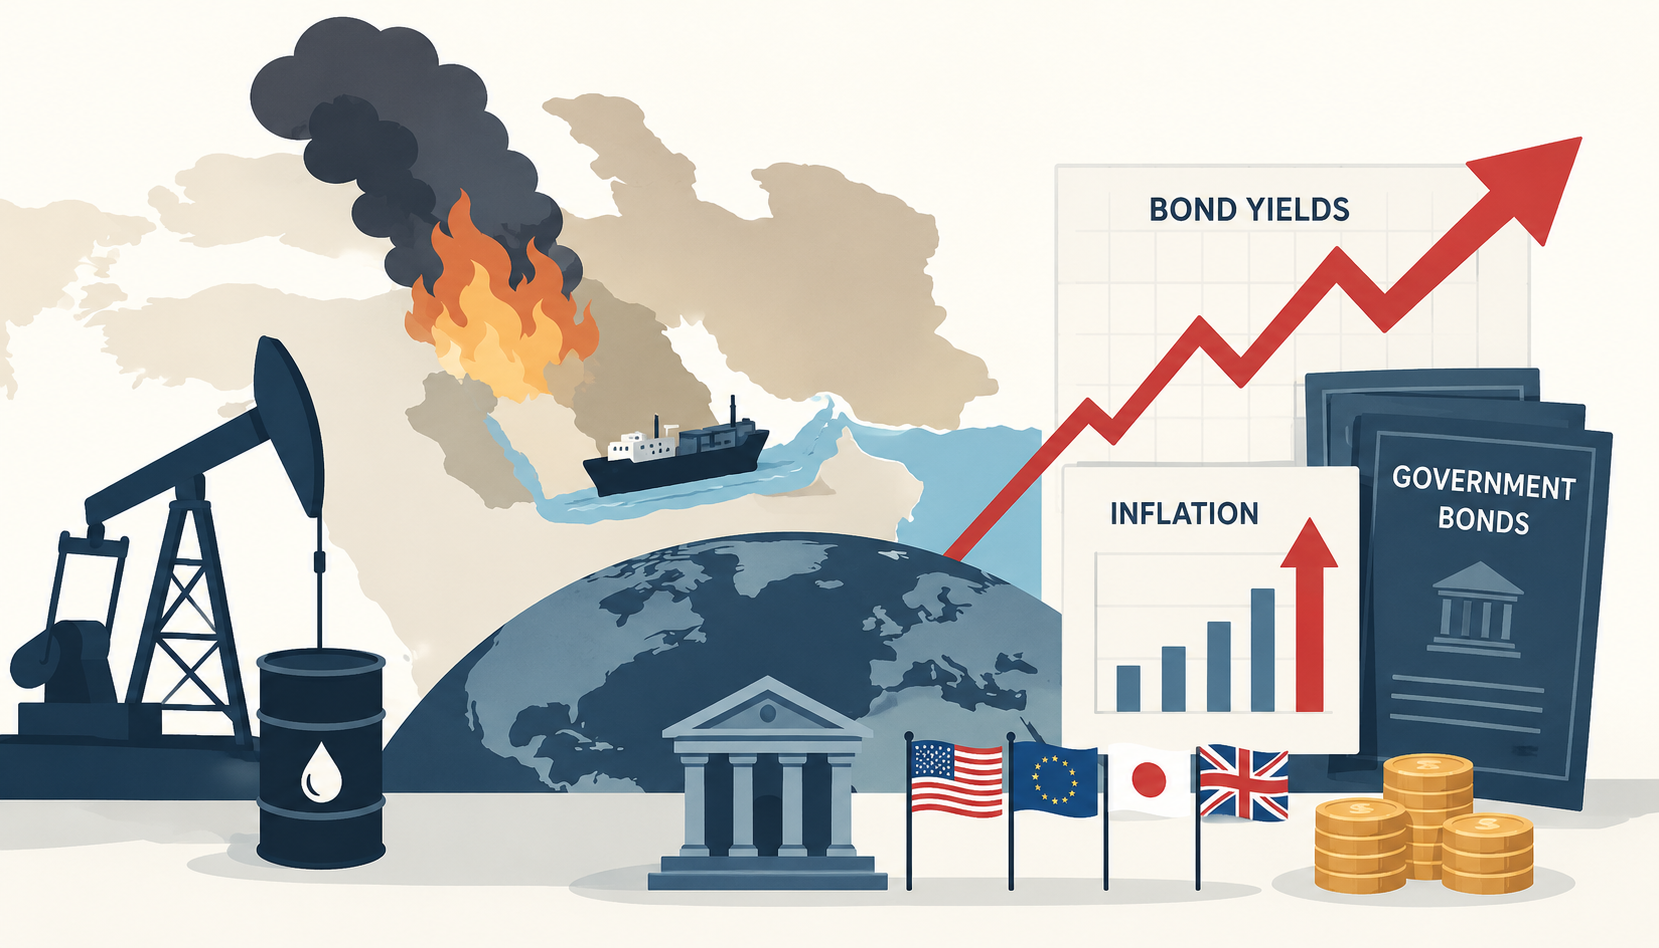
Energy is doing much of the damage. The index for energy rose 3.8 percent in April, accounting for over forty percent of the monthly all items increase. The trigger is geopolitical: the Iran conflict and disruption around the Strait of Hormuz have pushed oil to multi-year highs, and that has fed directly into headline inflation and, more importantly, into inflation expectations.
This is why long-dated bonds are especially exposed. A 30-year bond locks in a fixed nominal yield for three decades. If investors believe inflation will run hotter than previously assumed over that horizon, they demand more compensation to hold that paper — both for the erosion of purchasing power and for the term premium, the extra yield investors require simply for committing capital far into the future under uncertainty. When inflation expectations rise, that premium tends to rise with them, and the long end sells off hardest.
The Fiscal-Risk Dimension
Inflation is not the only force at work. The second driver is fiscal. Higher long-term yields are not just a market price; they are a direct cost to the government, because every dollar Washington borrows at the long end now carries a meaningfully higher interest bill.
That cost is already showing up at auction. On May 13, the Treasury sold $25 billion of 30-year bonds. A $25 billion auction of new 30-year bonds on Wednesday was awarded at 5.046% — the first time since 2007 the government issued 30-year debt at a 5% yield. Demand was lukewarm: the bid-to-cover ratio came in at 2.303, down from 2.385 in April, below the recent six-auction average of 2.43 and the weakest reading since November 2025. The bid-to-cover ratio measures total bids received against the amount on offer — a lower number signals softer appetite.
The scale of issuance ahead is large. As Bloomberg reported, the median budget deficit estimate of primary dealers of US Treasury securities released earlier this month showed a $1.95 trillion gap for the year ending in September and further widening to $2 trillion in 2027. Nuveen’s Laura Cooper captured the shift in market thinking bluntly, telling Bloomberg that yields are not just pricing inflation volatility, but increasingly the return of fiscal risk, with limited room for bond markets to absorb that spending without demanding more compensation.
The risk here is not a near-term U.S. default. It is something subtler: a feedback loop in which large deficits require heavy issuance, heavy issuance pushes yields up, and higher yields raise the future interest burden — which in turn widens the deficit further.
Impact on Housing, Equities, and the Dollar
For households, the most visible channel is housing. Mortgage rates track the 10-year Treasury yield closely, and that yield is now grinding higher. Freddie Mac’s Primary Mortgage Market Survey recently put the 30-year fixed rate at 6.36%, and with the 10-year pressing toward 4.7%, the near-term direction for mortgage costs is up rather than down. That keeps affordability stretched and weighs on construction — hence the slide in homebuilder shares on Tuesday.
For equities, the mechanism runs through valuations. When long-term yields rise, the discount rate investors apply to future corporate earnings rises too. Growth stocks, whose value depends heavily on profits expected years out, are the most sensitive. BMO’s Ian Lyngen framed the stakes precisely, telling Bloomberg that the ability of US equities to withstand the current bearish move in Treasuries is the true litmus test of the bond selloff, and that a move toward 5.25% on the 30-year could trigger a more durable pullback in valuations.
For the dollar, the picture is more two-sided. A high-yielding U.S. bond market can attract foreign capital and support the currency. But a stronger dollar combined with higher U.S. yields also tightens financial conditions globally — and that is where the spillover risk concentrates.
Global Spillover Channels
Rising U.S. long-term yields do not stay contained within U.S. borders. They reset the global cost of capital. When the world’s benchmark safe asset offers 5%, investors everywhere rebalance toward it, and capital tends to flow out of riskier markets and back toward U.S. assets.
Emerging markets feel this most acutely. Countries that have borrowed in dollars face higher refinancing costs as U.S. yields climb, and a firmer dollar makes servicing that debt more expensive in local-currency terms. Economies running external financing needs — current account deficits funded by foreign capital — are exposed to sudden shifts in investor appetite. The selloff is also visibly synchronized: Bloomberg noted weakness in European and Japanese government bonds alongside the U.S. move, a reminder that the inflation-and-deficits story is not uniquely American.
The Analyst’s View
From a country-risk and credit-risk standpoint, three implications stand out.
Duration risk is becoming a balance-sheet issue, not just a market story. A 30-year yield near or above 5% materially affects any institution holding long-duration assets — insurers, pension funds, banks, and asset managers. Risk managers should look beyond mark-to-market losses to the liquidity dimension: if long-dated bond portfolios are pledged as collateral, falling prices can trigger margin or collateral calls precisely when funding is tightest. The April auction’s weak bid-to-cover is a signal worth monitoring, because thinner demand at the long end raises the odds of further price volatility.
Higher long-end yields tighten financial conditions without a Fed hike. Even if the Federal Reserve leaves its policy rate unchanged — and the FOMC has now held at 3.5–3.75% for three consecutive meetings — the market is doing the tightening on its own. Higher long-term yields push up mortgage rates, corporate borrowing costs, and equity discount rates regardless of the policy rate. Notably, the April FOMC decision drew four dissents, the most since 1992, with three regional presidents resisting an easing bias — a sign the committee itself sees inflation risk skewed to the upside. For credit analysts, the practical takeaway is that weaker borrowers can come under stress through the market channel before any official rate move occurs.
Sovereign-risk analysis should focus on interest-cost feedback loops. For the U.S., the question is not solvency but the market’s tolerance for rising debt-service costs against a roughly $2 trillion deficit backdrop. For emerging-market sovereigns, the spillover is more immediate and more dangerous: higher U.S. yields strengthen the dollar, lift refinancing costs, and squeeze countries dependent on external funding. Exposures to dollar-indebted borrowers in those economies warrant closer scrutiny of refinancing schedules and FX mismatch — and, where IFRS 9 frameworks apply, a hard look at whether qualitative overlays adequately capture a higher-for-longer rate environment.
What to Watch Next
The next few weeks offer several concrete signposts. The Federal Reserve releases the minutes of its April meeting on May 20, which should reveal how deep the internal divide over rate policy runs as new Chair Kevin Warsh settles in. The May CPI report is due June 10, and the June FOMC meeting on June 16–17 will bring updated economic projections. Beyond the calendar, the indicators that matter most are upcoming Treasury auctions and their bid-to-cover ratios, mortgage rate data, credit spreads, and emerging-market currency moves. And the single cleanest gauge of whether this selloff becomes something more serious is simple: whether equities can hold their ground as the 30-year yield tests 5.25%.